Blog by Tran Thi Hoa
The pollution of plastic waste in aquatic environments is a global concern due to its severe impact on organisms (Steer et al., 2017). In recent years, microplastics (MPs) have been a major focus in ocean waste concerns. Although there is no universally agreed-upon definition for microplastics, fragments with a diameter less than 5 mm are typically classified as microplastics (NOAA, 2018). Microplastics can originate from small plastic particles used in the cosmetic industry or from primary plastic fragments produced before manufacturing, such as nurdles (Zettler et al., 2013). Secondary microplastics can also be generated from larger plastic fragments, undergoing breakage and decomposition due to exposure to environmental water conditions, such as UV-B radiation, salinity, and wave energy (Figure 1). Plastic fragmentation is further promoted by the microbial ecosystem, with many studies indicating the formation of nano-sized plastics from microplastics under the influence of various bacterial species (Chagnon et al., 2018). With their nanoscale dimensions, microplastics can easily enter the bodies of various organisms, including seabirds, filter-feeding whales, and even planktonic organisms like fish larvae (Steer et al., 2017).

Figure 1. Microplastic classification (Borah et al., 2023)
In recent years, numerous studies have been conducted on microplastics, including research on their sources, transport, adsorption of organic pollutants on MP surfaces, and their toxic effects from riverine systems to marine systems. To assess the level of microplastic pollution in the water environment, the process of sampling and analysis in the laboratory is extremely important. For this reason, sampling and extraction of microplastic abundances and distributions have now been included in the objectives of the 3SIP2C project (Figure 2).

Figure 2. The procedural steps involved in the sampling, extraction, and characterization processes of microplastics
Microplastic sampling and storage
To collect microplastics in water samples, we apply a pump system with an 80 µm mesh-size plankton net to take approximately 300 – 800 liters per sample from different layers of the water column (Figure 3). Later, on the ship, we collect the materials from the plankton net and transfer them to sterilized 50 mL Falcon tubes. These samples are then stored and preserved at 4°C in the laboratory.

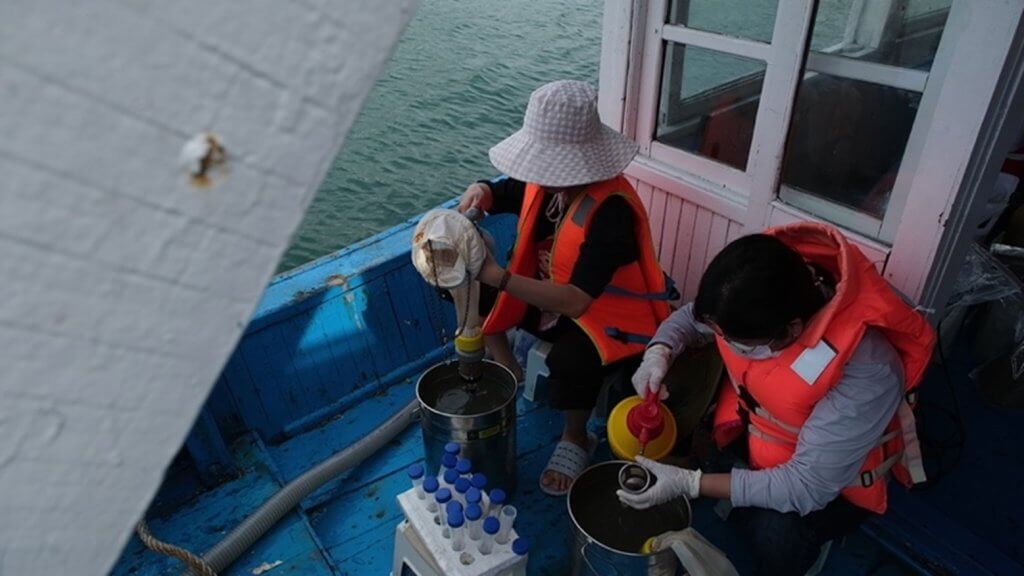
Figure 3. The pump system with a plankton net is used to sample the water sample for microplastics
To collect microplastics in sediment samples, we use an Ekman bucket (Figure 4), obtaining a mass of 3-5 kilograms per sample. After the cruise, sediment is transferred to the lab, washed with RO water through a sieve system to maintain a size range of 0.08 – 1 mm. These samples are then dried to a constant weight and stored at 4°C in the laboratory for further analysis.
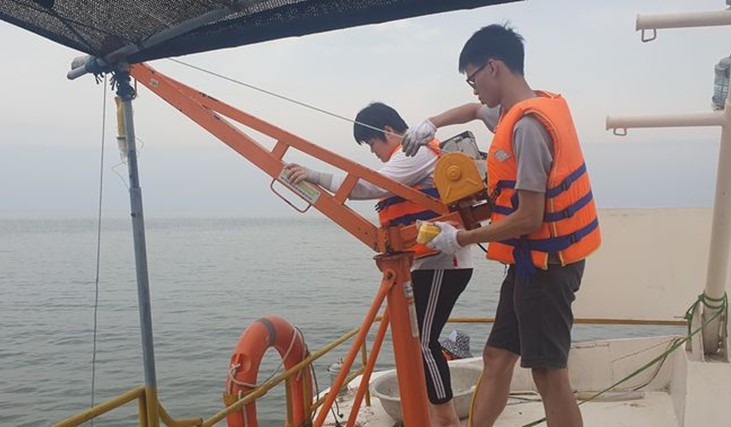
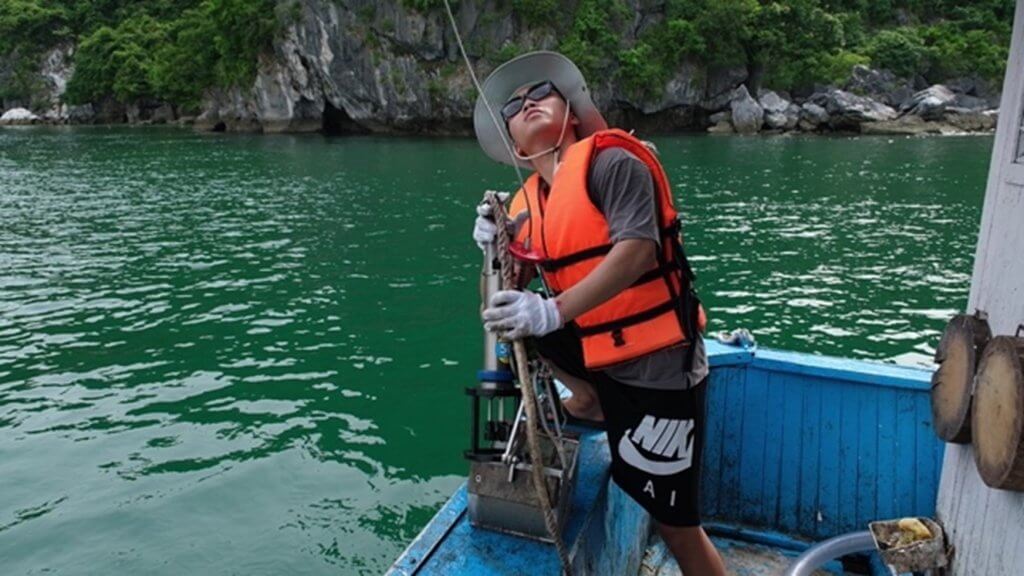
Figure 4. Sediment samples were collected by the Ekman sampling system
Microplastic extraction and characterisation
For the analysis of microplastic concentration, organic matter should be removed as much as possible (Figure 5).
In this research, we used a modified Fenton’s reaction to remove all organic materials. Subsequently, water samples were wet sieved (mesh size 0.08 mm), while sediment samples were treated using density separation with saturated CaCl2. Microplastics in each sample were collected using a stereo microscope. After quantification, microplastics were investigated for polymer composition via Fourier-transform infrared (FTIR) spectroscopy by Thermo Fisher Scientific. Contamination was evaluated using blank samples, and values were subtracted from sample results.
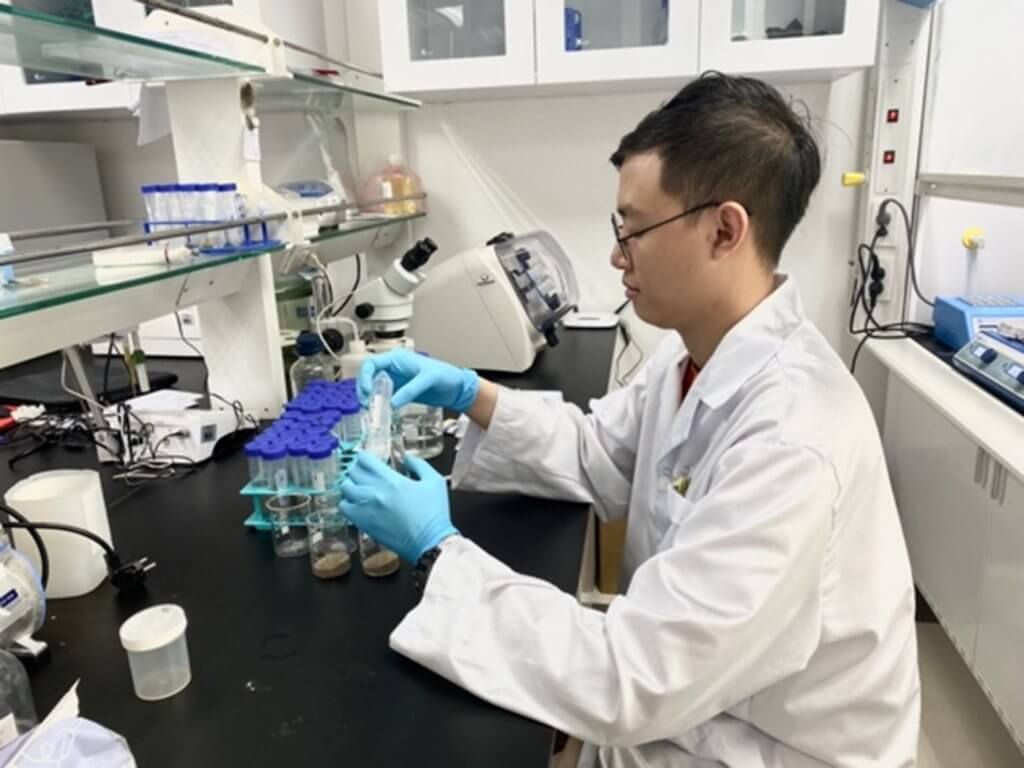
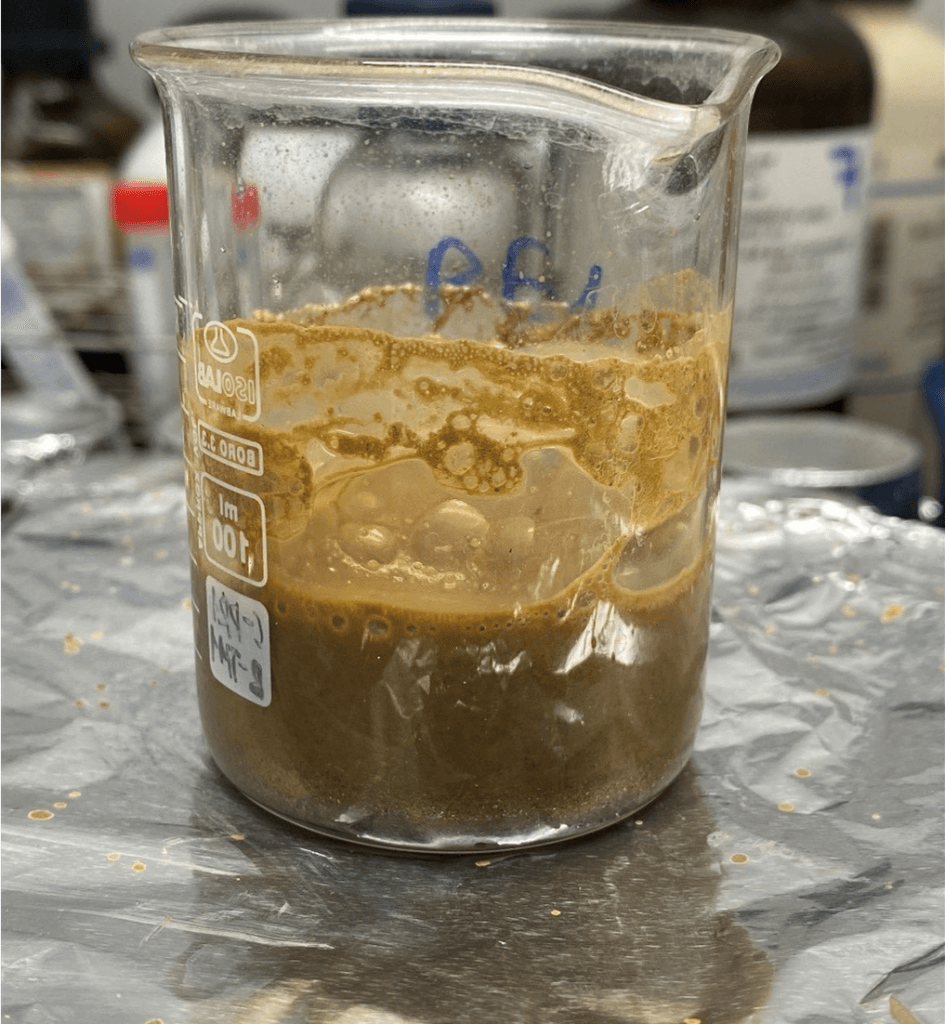
Figure 5. The technician prepared sediment samples for Fenton’s reaction.
Preliminary results
In the samples we have collected so far, a large variability in the amounts and types of these microplastics has been observed. Microplastics were classified by shape and type of polymer. In 225 water samples and 75 sediment samples collected in March 2023, fiber microplastics were the most common form in all samples, followed by fragments. FTIR analysis results showed that over 10 types of plastic appeared in the analyzed samples, for example: Nylon, Rayon, PTO, PET, PVA, PVC, PTFE (Teflon), Saran, PP, PPTA,… In the Red River Delta region, the predominant types of microplastics are PET, PTO and Nylon, constituting a significant majority. Conversely, within Cat Ba Island, the primary microplastics are Nylon, Resin, and PET, representing the highest proportion. A noteworthy observation in this context is the presence of PS (polystyrene) in Cat Ba, which can be rationalized by the aquaculture practices prevalent in this area.
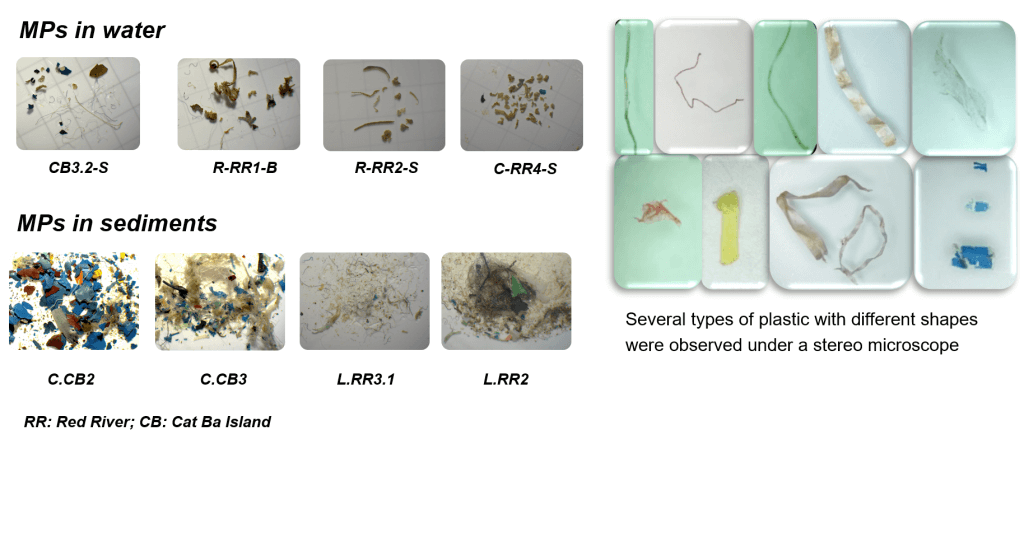
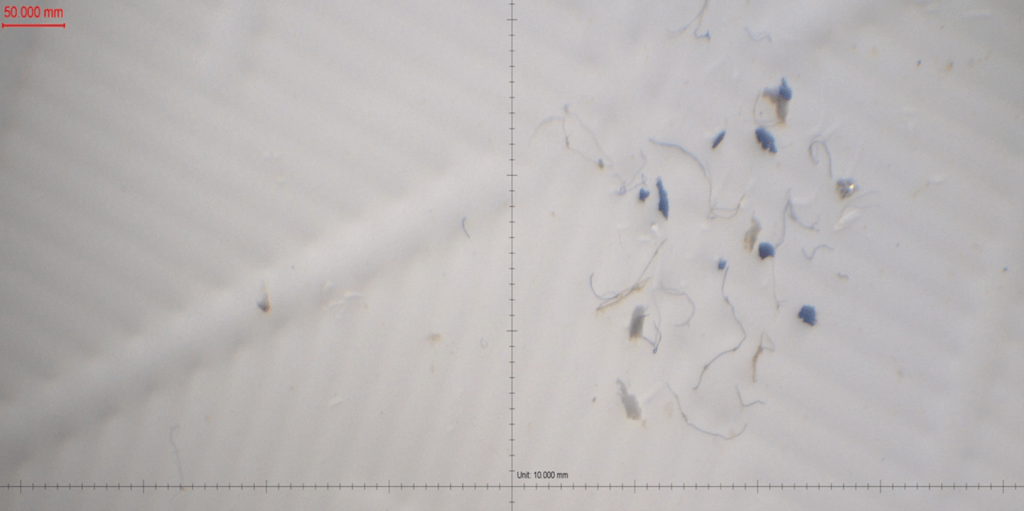
Figure 6. Microplastics collected in water and sediment samples
References
- Borah, S.J., Gupta, A.K., Gupta, A. et al. Grasping the supremacy of microplastic in the environment to understand its implications and eradication: a review. J Mater Sci 58, 12899–12928 (2023).
- Steer M, Cole M, Thompson RC, Lindeque PK. Microplastic ingestion in fish larvae in the western English Channel. Environ Pollut. 2017 Jul;226:250-259.
- Zettler ER, Mincer TJ, Amaral-Zettler LA (2013) Life in the “plastisphere”: microbial communities on plastic marine debris. Environ Sci Technol 47(13):7137–7146.
- Chagnon, M. Thiel, J. Antunes, J. L. Ferreira, P. Sobral and N. C. Ory Environmental Pollution 2018 Vol. 243 Pages 127-133.